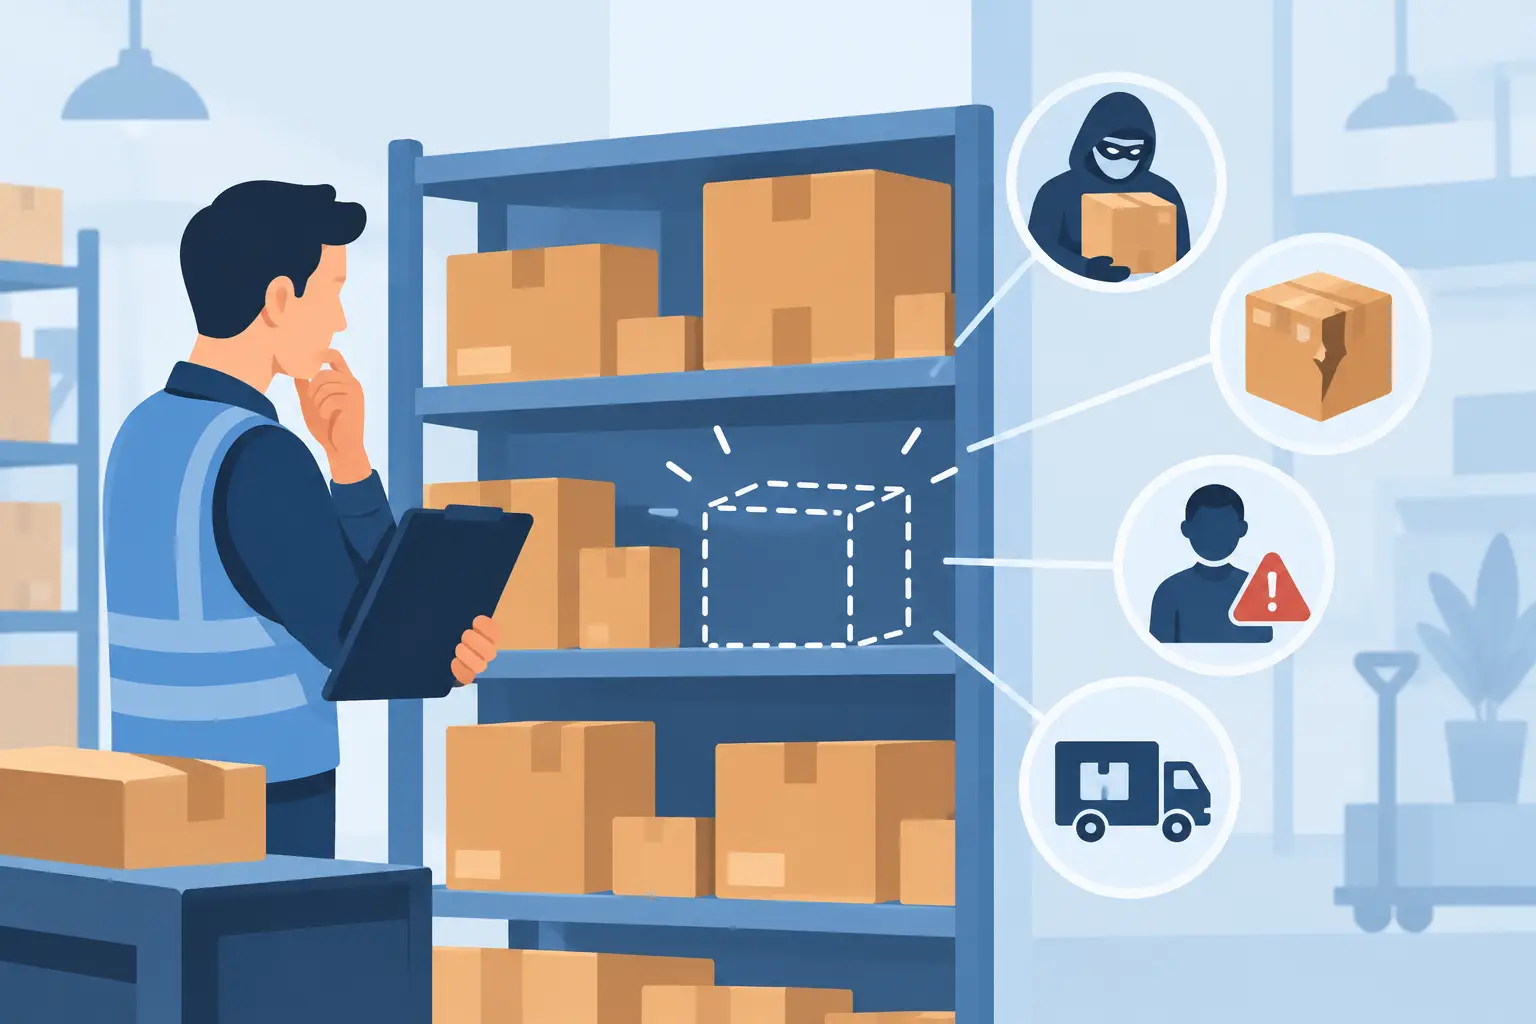
A production manager sees output falling on a line, while finance is still waiting for last week’s cost report and the warehouse team is working from a separate stock spreadsheet. The issue is not a lack of data. It is that the data lives in different places and reaches decision-makers too late. An ERP with Power BI integration brings operational and financial information into one reporting environment, so teams can see what is happening, investigate why, and respond with confidence.
For Australian businesses with complex operations, this matters well beyond attractive dashboards. It changes how managers plan production, control inventory, monitor labour, protect margins and report on performance across sites.
What ERP with Power BI integration actually does
ERP is where daily business transactions happen. It records sales orders, purchase receipts, invoices, stock movements, job costs, production consumption, timesheets and general ledger entries. Power BI turns that transactional information into interactive reports, scorecards and visual analysis that can be tailored to each role.
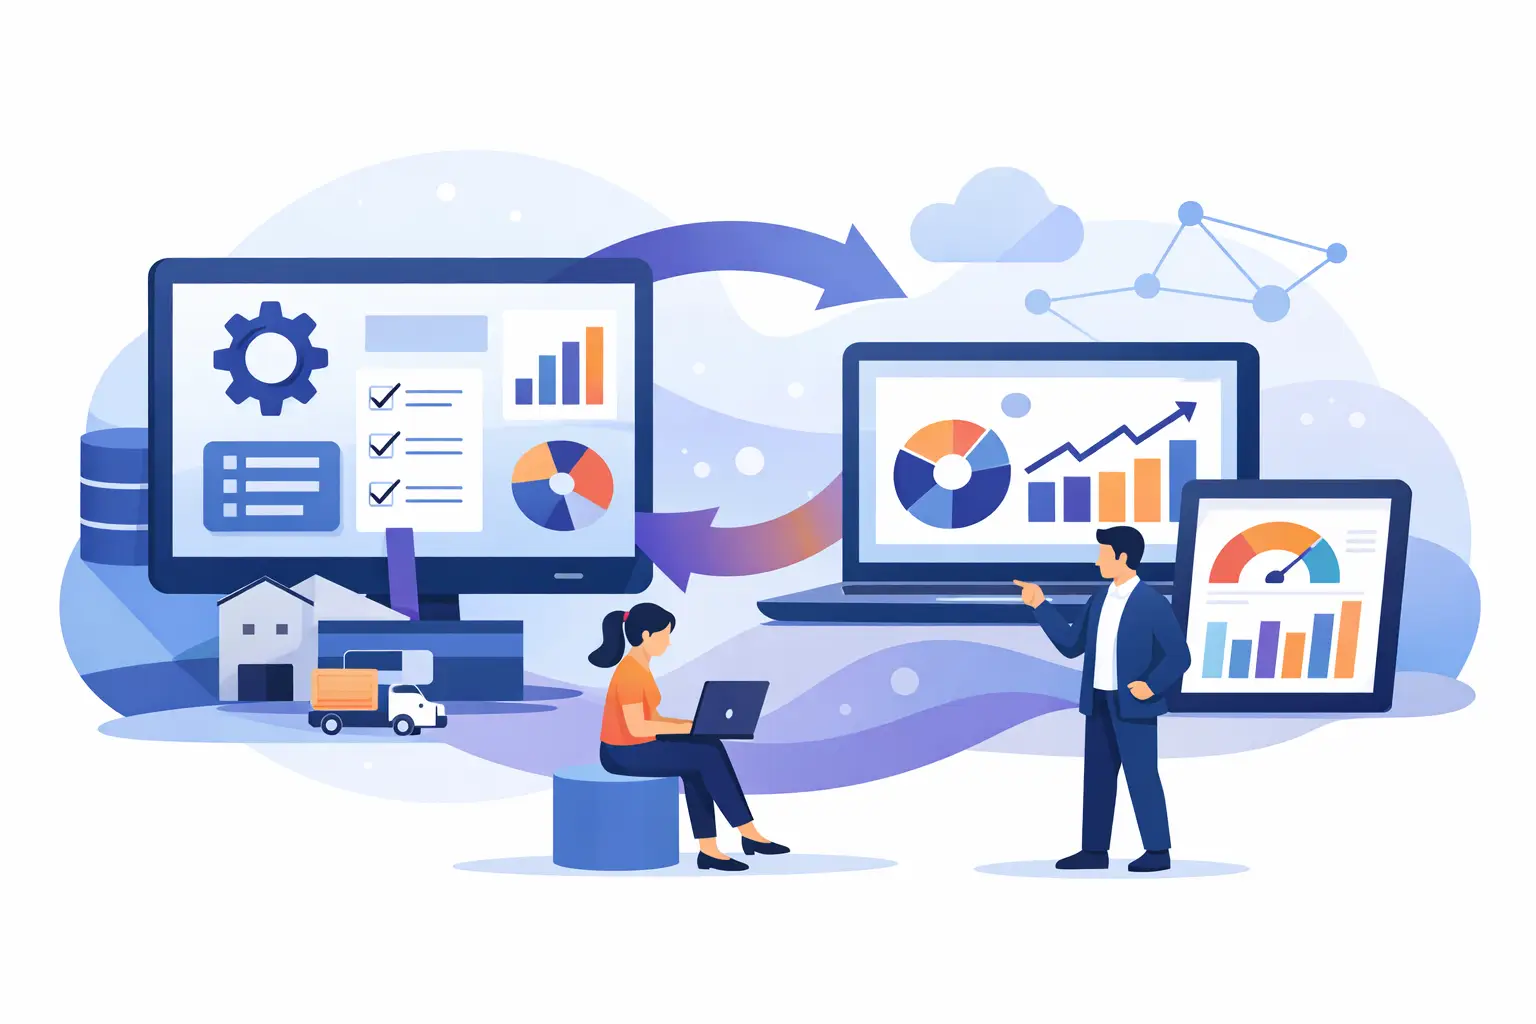
The integration creates a governed path from ERP data to reporting. Rather than exporting spreadsheets at month end, a finance manager can review revenue, aged receivables and cash position from current ERP records. A warehouse manager can see stock on hand, stock ageing, backorders and inventory turnover. A plant manager can compare planned output against actual production, scrap, downtime and material use.
The value comes from joining these measures together. If gross margin drops, a dashboard can help determine whether the cause is a discount, a higher supplier cost, excess labour hours, yield loss or an unplanned production stoppage. Teams no longer need to spend hours reconciling reports before they can have the real conversation.
The operational questions that become easier to answer
Power BI is most useful when it serves decisions people need to make regularly. A generic executive dashboard may look polished but deliver little value if it does not lead to action. The strongest reporting starts with questions that affect cash, service, capacity or profitability.
For a distributor, this may mean identifying slow-moving lines tying up working capital, customers whose buying patterns are changing, or suppliers causing missed delivery commitments. For a manufacturer, it may mean tracking actual versus standard costs by production order, comparing machine output between shifts, or finding where scrap is eroding a product margin.
Labour-hire businesses can view filled shifts, billable hours, pay costs, client profitability and compliance status in a single management view. Hospitality and retail operators can analyse daily sales by location, product group and time period alongside stock availability and labour allocation. Professional practices can monitor work in progress, utilisation, project budgets and overdue invoices without assembling reports from several applications.
When the ERP also receives data from machines, PLCs or operational devices, the opportunity becomes more significant. Machine readings, cycle counts and downtime events can be assessed beside production orders, material usage and job costs. That connection helps teams move from reporting an issue to locating the part of the process that needs attention.
Why spreadsheets and disconnected reports create risk
Spreadsheets still have a place for analysis, modelling and one-off planning. They become a problem when they are the primary reporting layer for operational performance. Manual exports create version confusion, formula errors and a constant delay between a transaction being recorded and a report being available.
Disconnected systems create a second problem: conflicting definitions. Sales may calculate revenue one way, finance another, and operations may focus on a third number based on dispatches rather than invoices. An ERP with Power BI integration can establish common measures and agreed reporting logic, giving each team a view suited to its role without changing the underlying facts.
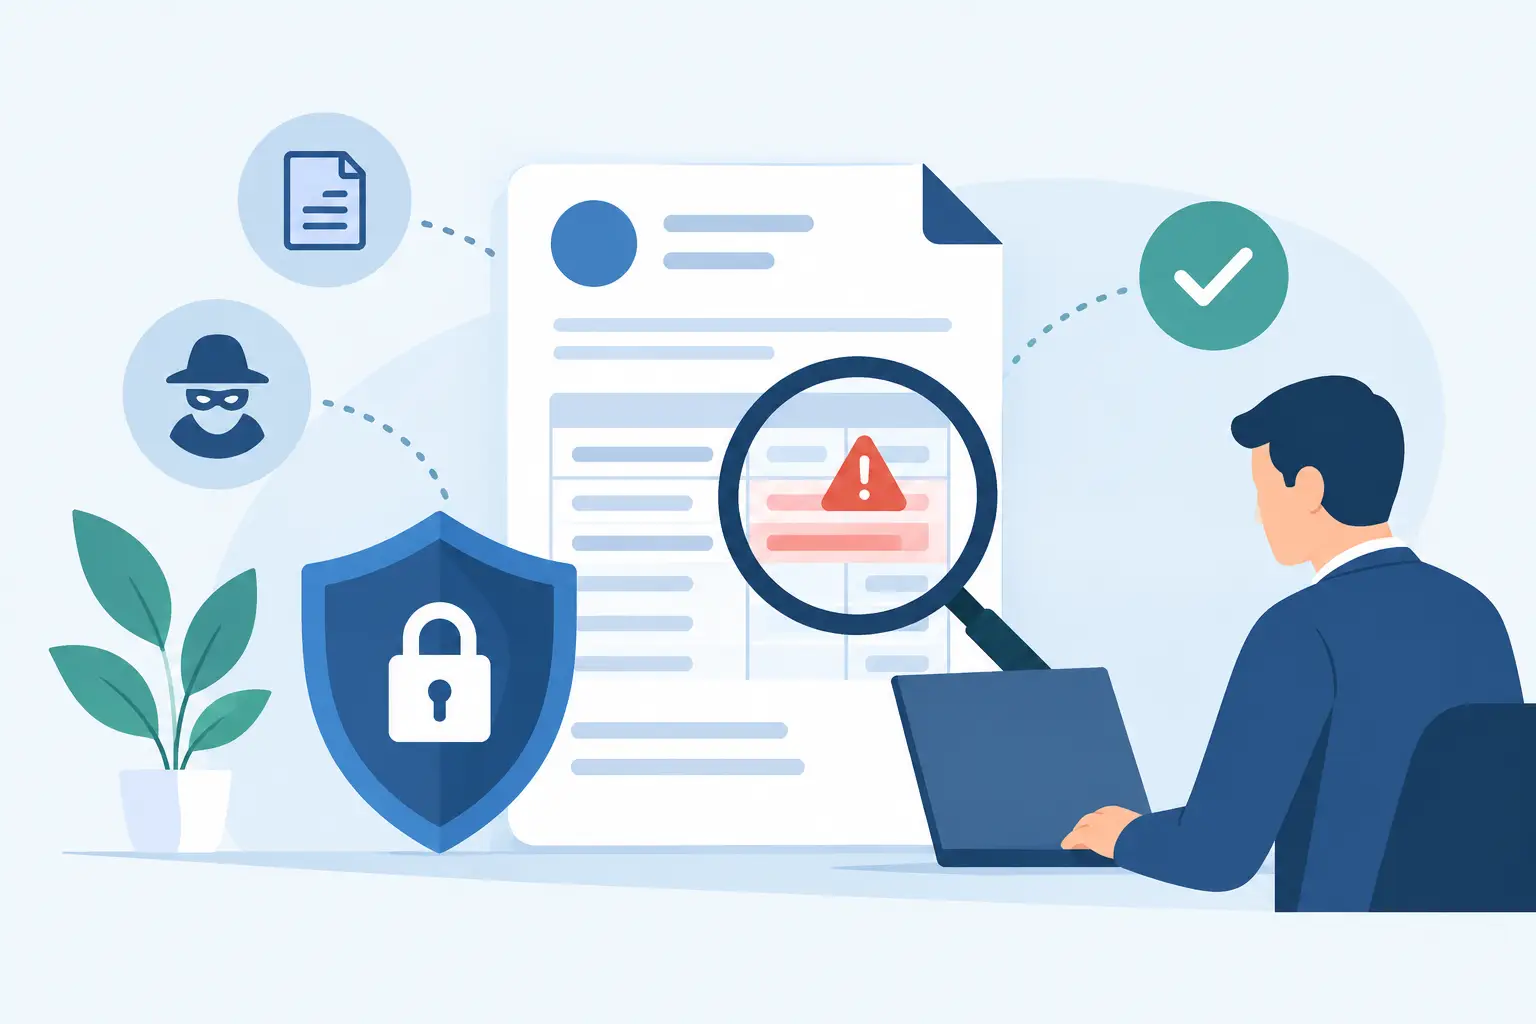
This does require discipline. A dashboard cannot correct inaccurate item masters, incomplete timesheets or inconsistent job coding. Data quality, approval workflows and user training remain essential. Reporting should expose data gaps early rather than hide them behind attractive visuals.
Build the reporting model before the dashboard
The temptation is to begin with charts. A better approach is to define the measures, reporting cadence and decisions each report will support. Start with a small set of high-value use cases, such as weekly production performance, stock risk, project profitability or month-end financial reporting.
Define measures in business language
Terms such as gross margin, available stock, on-time delivery and utilisation sound clear until different departments calculate them differently. Agree on the definition, source transactions, inclusions and exclusions before building visualisations.
For example, stock on hand may include all physical inventory, while available-to-promise stock excludes quantities already committed to sales orders and reserves material for production. Both measures are useful, but they answer different questions. Clear definitions avoid avoidable debate in management meetings.
Design for the person taking action
A chief financial officer may need a concise view of revenue, margin, cash flow and exceptions. A production supervisor needs shift-level output, rejected units and jobs at risk. A purchasing officer needs supplier lead times, purchase order status and replenishment requirements.
Role-based reporting prevents a common mistake: building one massive dashboard that tries to serve everyone. Users should be able to move from an overall KPI to the relevant customer, item, job, location or transaction detail when investigation is required.
Set a sensible refresh schedule
Not every report needs second-by-second data. Financial reporting may refresh daily or at scheduled intervals, while live production or dispatch monitoring may justify more frequent updates. The right schedule depends on the decision being made, data volume and available platform capacity.
Frequent refreshes can be valuable, but they also increase technical complexity and may encourage teams to react to normal short-term variation. Match the refresh cycle to the operational rhythm rather than assuming real time is always better.
Security and governance cannot be an afterthought
ERP information includes payroll, customer pricing, supplier agreements, financial results and sometimes personal details. Power BI reporting needs the same care as the ERP itself. Access should be based on roles, with users seeing only the sites, departments or entities relevant to their responsibilities.
Row-level security is particularly useful for organisations with multiple branches, business units or client-facing managers. A regional manager can view their own locations without gaining access to every entity’s financial information. Executives can retain a consolidated view where appropriate.
Governance also covers report ownership, change control and data refresh monitoring. If a key report breaks quietly or a measure changes without documentation, trust declines quickly. Organisations should nominate accountable owners for critical datasets and establish a practical process for testing changes before release.
A practical implementation path
The most reliable ERP with Power BI integration projects are phased. Begin by connecting the core ERP data required for a defined business outcome, then expand after users have validated the results.
A typical first phase includes finance, sales, purchasing, inventory and a set of executive KPIs. The next phase may add production, project costing, point of sale, labour data, carbon accounting or machine and PLC information. The order should reflect the business bottleneck, not a generic software checklist.
During implementation, validate figures against existing trusted reports and transaction records. Small differences often reveal timing rules, missing dimensions or inconsistent coding that need to be resolved. Give operational users access early and ask whether the report helps them make a better decision in their normal workday. If it does not, revise it.
OneBusiness can configure ERP workflows and Power BI analytics around the operational measures that matter to manufacturers, warehouses, labour-hire firms and other complex businesses. The goal is not more reporting for its own sake. It is a connected platform that gives teams useful visibility without adding another manual process.
What good looks like after go-live
A successful reporting environment becomes part of the operating routine. Morning meetings focus on current exceptions rather than assembling numbers. Finance can investigate a margin movement without requesting multiple exports. Operations can see the cost and service impact of production or stock issues while there is still time to respond.
It also supports more disciplined planning. Historical ERP data can reveal seasonal demand, supplier performance, capacity constraints and recurring causes of rework. With reliable data in place, teams can use forecasting and AI-enabled analysis more effectively because they are working from consistent operational records.
The best starting point is usually one decision that is currently slowed by fragmented information. Connect the data behind that decision, agree on what the numbers mean, and make the report useful enough that people choose to use it. That is how analytics becomes a practical part of running the business, not another screen to check.
Power BI Integration for Sustainability Reporting
OneBusiness ERP integrates Microsoft Power BI across its reporting capabilities, including the Carbon Accounting and Sustainability module, to provide interactive dashboards and data-driven business insights. Rather than relying solely on static reports or manually consolidated spreadsheets, organizations can use Power BI to display dynamic reports and dashboards based on data captured within the ERP. Sustainability information such as energy consumption, carbon emissions, waste generation, business travel, employee commuting, transportation, raw materials, and other environmental activities can be consolidated and visualized, giving users a centralized view of operational and sustainability performance.
Our ERP with Power BI integration enables organizations to analyze Scope 1, Scope 2, and Scope 3 emissions, energy usage, emission trends, sustainability KPIs, and other environmental indicators through interactive reports and dashboards. Beyond sustainability reporting, Power BI can also be used to present insights from different ERP modules, allowing management and operational teams to monitor key business metrics in a visual and accessible format. Users can drill down into information, compare performance across periods or business areas, identify trends and areas requiring attention, and use these insights to support informed decision-making. By combining OneBusiness ERP data with Power BI reporting and dashboard capabilities, organizations gain a centralized, visual, and data-driven approach to monitoring both business and sustainability performance.
OneBusiness ERP integrates Microsoft Power BI to provide interactive reports and dashboards. Power BI is Microsoft’s business intelligence and data visualization platform, enabling organizations to connect, analyze, and visualize data through interactive reports and dashboards. Learn more about Microsoft Power BI