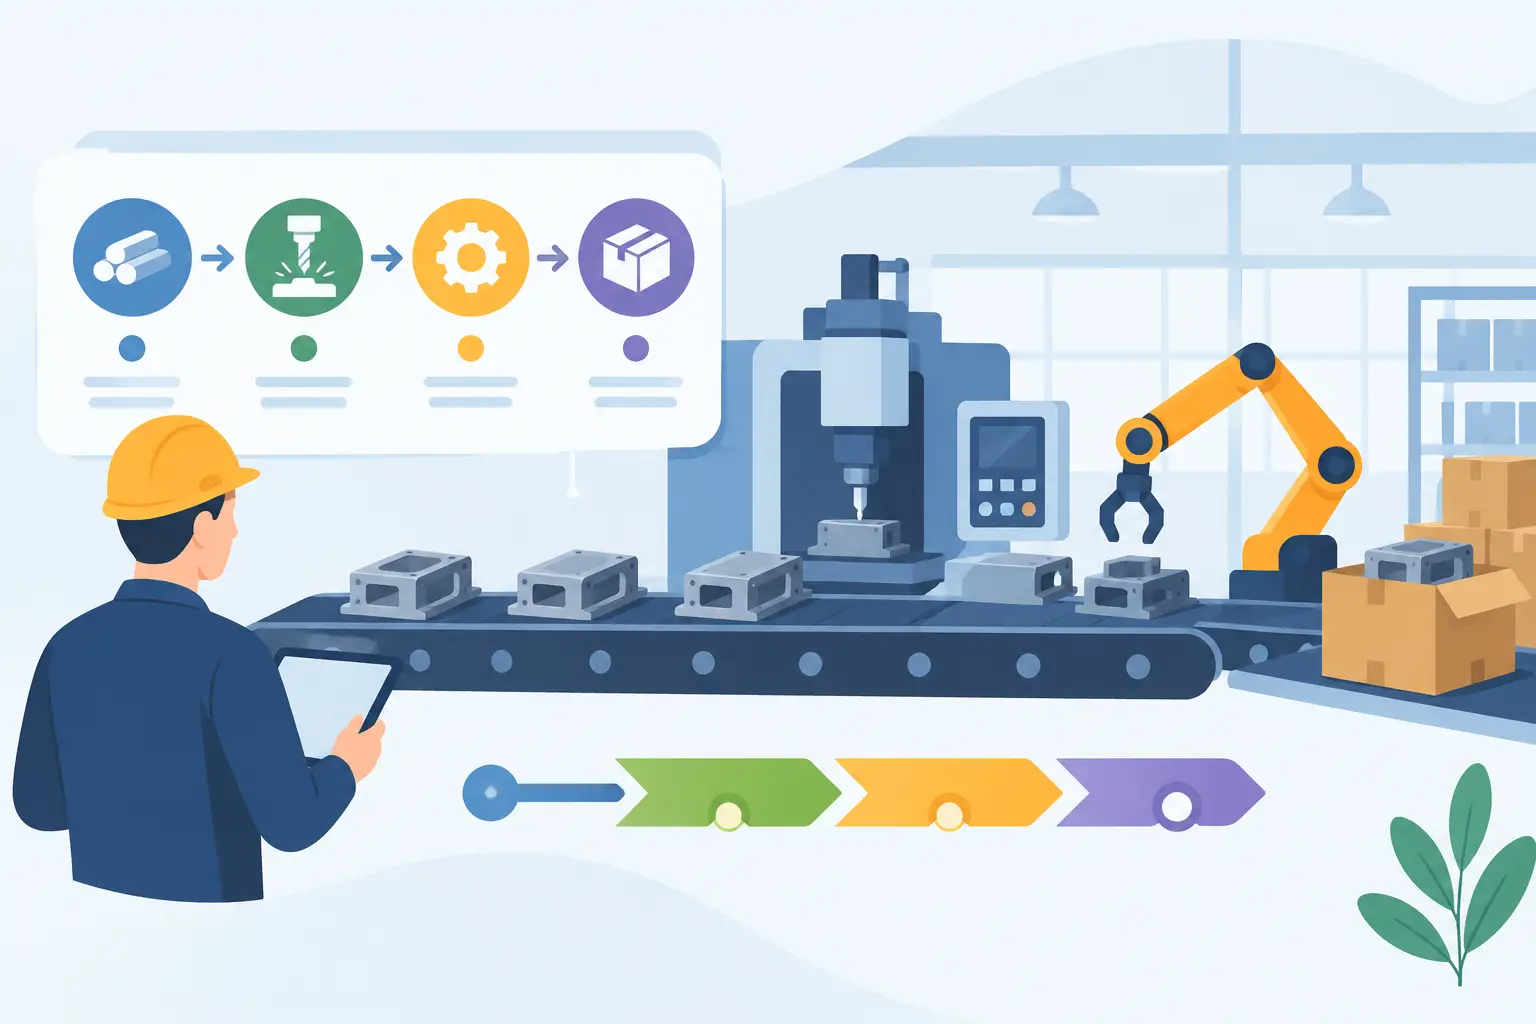

A diesel invoice, an electricity bill and a production run can each tell part of your emissions story. The challenge is that they usually sit in different systems, spreadsheets or inboxes. Understanding how carbon reporting works helps finance and operational teams turn those everyday records into a credible view of the business’s environmental impact – and use it to make better decisions.
For Australian businesses, carbon reporting is becoming a practical management discipline, not just a sustainability exercise. Customers may request emissions data in tenders, larger supply-chain partners may seek supplier information, and boards increasingly want visibility over energy, fuel, waste and production efficiency. The quality of the report depends less on polished presentation than on whether the underlying operational data is complete, traceable and consistently calculated.
What carbon reporting is designed to show
Carbon reporting measures greenhouse gas emissions associated with an organisation’s activities over a defined period. Results are commonly expressed as tonnes of carbon dioxide equivalent, or tCO2-e. This unit converts gases with different warming effects, such as methane and refrigerant gases, into one comparable measure.
A report may be prepared for internal management, a customer questionnaire, a lender, an annual sustainability statement or a formal regulatory requirement. The level of detail changes with the purpose. A manufacturer bidding for a major contract may need product or site-level emissions evidence, while a growing warehouse business may initially need a reliable organisation-wide baseline to identify its largest sources.
The core principle is straightforward: record an activity, apply an appropriate emissions factor, and document the calculation. In practice, good reporting also requires clear organisational boundaries, sound data controls and a method that can be repeated next month and next year.
How carbon reporting works, step by step
1. Set the reporting boundary
Before collecting numbers, decide what the report covers. This includes the legal entities, sites, vehicles, equipment and operations under the organisation’s control or ownership. A group with a head office, warehouse, retail outlets and a processing facility needs to establish whether all locations are included and from what date.
The reporting period is usually a financial year, although monthly reporting is valuable for operational control. Boundary decisions should be recorded rather than assumed. Acquiring a new site halfway through the year, outsourcing transport, or moving production to a contractor can materially change the emissions picture.
2. Classify emissions into scopes
Most carbon reporting follows the Greenhouse Gas Protocol framework, which groups emissions into three scopes.
Scope 1 covers direct emissions from sources the business owns or controls. Examples include natural gas used in a boiler, diesel in company vehicles, LPG for process heat and refrigerant leaks from air-conditioning or cold storage equipment.
Scope 2 covers indirect emissions from purchased energy, most commonly electricity. For operations with high electricity use – such as manufacturing, washing, processing, hospitality or refrigerated warehousing – this is often an immediate area for analysis.
Scope 3 covers other indirect emissions across the value chain. It can include purchased goods, freight, employee commuting, business travel, waste, leased assets and the use of sold products. Scope 3 is usually the most complex category because the information may sit with suppliers and customers rather than inside the business.
Not every business needs every Scope 3 category from day one. The sensible approach is to identify material categories, state what is included, and improve coverage over time. Claiming precision where supplier data is weak is less useful than clearly disclosing a reasonable estimate and its limitations.
3. Gather activity data from daily operations
Activity data is the measurable business record behind an emissions calculation. It may be litres of diesel purchased, kilowatt-hours of electricity consumed, kilograms of refrigerant topped up, kilometres travelled, tonnes of waste collected or kilograms of raw material purchased.
This is where fragmented systems create unnecessary work. Finance may hold supplier invoices, operations may have machine readings, maintenance may record refrigerant servicing, and fleet teams may use fuel cards. A carbon reporting process needs a clear owner for each data source, a collection timetable and enough detail to identify the relevant site, cost centre or production line.
For operationally intensive businesses, direct data capture improves both accuracy and usefulness. Meter readings, PLC-connected machine data, production volumes and inventory movements can show whether emissions are rising because output increased, because a machine is inefficient, or because energy use changed independently of production.
4. Apply emissions factors and calculate tCO2-e
An emissions factor converts an activity measure into greenhouse gas emissions. For example, electricity consumption in kilowatt-hours is multiplied by the applicable electricity emissions factor. Fuel litres are multiplied by a factor for that fuel type. The resulting emissions are then recorded as tCO2-e.
The calculation itself is not difficult. Choosing the correct factor, year, geography and unit is where errors often occur. Teams should use recognised, current factors appropriate to their reporting method and retain the source, version and calculation logic. Mixing factors from different years without explanation can distort comparisons.
Estimates are sometimes necessary. If a landlord controls a meter and only a shared bill is available, energy may need to be allocated using floor area, operating hours or another documented method. Estimates should be labelled, reviewed and replaced with primary data where practical. The aim is better decision-quality information, not false certainty.
5. Validate the data and maintain an audit trail
Carbon data needs the same discipline as financial data. A useful validation process checks for missing months, unexpected changes, duplicated invoices, mismatched units and values that do not align with operational output.
For instance, a sudden fall in diesel emissions might reflect a genuine fleet change, but it could also mean fuel-card transactions were omitted. A spike in electricity may be explained by extended production shifts, hot weather, equipment faults or a billing adjustment. Reviewing emissions alongside production, sales, headcount and inventory movements helps teams distinguish a real operational change from a data issue.
Keep source documents, calculation files, assumptions, factor references and approval records together. This audit trail makes the report easier to explain to customers, auditors and management. It also avoids rebuilding the process from scratch each reporting cycle.
Turning an emissions report into an operating tool
A carbon report becomes valuable when it is connected to decisions. Total emissions matter, but intensity measures often reveal more. A food processor may track tCO2-e per tonne produced. A labour-hire business may monitor emissions per worker placement or per kilometre travelled. A retailer may compare electricity emissions per square metre across stores.
These measures should be interpreted carefully. Lower emissions per unit can signal improved efficiency, yet total emissions may still rise as the business grows. Both views are needed when setting targets, planning capital expenditure or responding to stakeholder requests.
A connected ERP platform can reduce manual handling by bringing purchasing, inventory, payroll, production, fleet, energy and finance records into one place. Carbon accounting can then use the same operational transactions that teams already rely on for billing, stock control and planning. For businesses with complex production or multi-site operations, this creates a clearer line from machine and material activity to management reporting.
OneBusiness supports this approach by combining operational workflows, analytics and carbon accounting within a configurable cloud platform. The right setup will depend on the industry, existing data quality and whether the immediate priority is compliance, tender readiness, cost reduction or a broader sustainability program.
Common reporting mistakes to avoid
The most common mistake is treating carbon reporting as a once-a-year spreadsheet task. Annual reporting can meet a narrow requirement, but it is too slow to identify avoidable energy use, fuel leakage or process inefficiency while there is time to act.
Another issue is collecting more data than the business can maintain. Start with material emission sources and a repeatable process. A smaller, well-controlled dataset is more credible than an ambitious report built on inconsistent assumptions.
Finally, do not separate emissions reporting from commercial reporting. Energy, fuel, waste and material consumption all carry costs. When carbon metrics sit beside margin, production yield, stock loss and asset performance, teams can prioritise actions that support both operational efficiency and emissions reduction.
The best carbon report is not the one with the most charts. It is the one your finance and operations teams can explain, trust and use when deciding what to change next.