A monthly energy bill can tell a business what it spent. It cannot reliably show which production line, delivery route, site, supplier or product created the emissions behind that cost. That gap is why carbon accounting software for businesses is becoming an operational requirement, not just a sustainability reporting exercise.
For manufacturers, processors, warehouses, plantations and labour-hire businesses, emissions data sits across the same activities that already drive margin, capacity and customer service. Electricity is consumed by machines. Fuel is used by vehicles and equipment. Materials move through stores, work orders and finished goods. Labour and subcontractors support jobs across multiple sites. Carbon reporting is most useful when it reflects this operational reality.
What carbon accounting software should actually do
Carbon accounting software for businesses converts business activity into measurable greenhouse gas emissions. It collects source data, applies appropriate emissions factors, records calculations, and produces reports that finance teams, operational leaders, and external reviewers can understand. By centralizing emissions data and calculations, carbon accounting software for businesses can provide a more consistent approach to measuring and reporting an organization’s carbon footprint.
The software should do more than create a yearly total. Effective carbon accounting software for businesses allows teams to see emissions by legal entity, location, department, project, customer, production batch, or product line. That level of detail changes the conversation. Rather than asking why total emissions rose, managers can investigate whether a change came from a higher-volume contract, inefficient equipment, a fuel-intensive route, or a supplier category.
For many small and mid-sized businesses, the first aim is dependable Scope 1 and Scope 2 reporting. Scope 1 covers direct emissions, such as fuel burned in company vehicles, forklifts, boilers, or generators. Scope 2 covers purchased electricity. Scope 3 captures indirect value-chain emissions, including purchased goods, freight, waste, business travel, and other supplier-related activity. Carbon accounting software for businesses can help organize these different emission sources within a single reporting framework.
Scope 3 can be more complex, particularly where supplier information is incomplete. That does not mean businesses should wait for perfect data. Good carbon accounting software records the data source, estimation method, emissions factor, and calculation period, so assumptions remain visible and can be improved over time.
Why disconnected data makes reporting difficult
A spreadsheet can be a useful starting point. It becomes less reliable when multiple people update it, bills arrive late, sites use different units of measure, or management asks for results by product and customer. Each manual transfer introduces delay and the possibility of error.
The larger issue is that financial and operational records are often disconnected. Accounts payable may hold utility and freight invoices. Warehouse systems capture stock movements. Production teams record output and machine hours elsewhere. Fleet fuel may sit in a separate provider portal. When the information is fragmented, carbon reporting becomes a retrospective reconciliation task.
Connected carbon accounting changes the workflow. Energy invoices can be matched to facilities and cost centres. Fuel purchases can be assigned to vehicles, equipment or projects. Inventory and purchasing records can support calculations for materials and supplier categories. Production volumes can provide an intensity measure, such as kilograms of CO2-e per tonne produced, per unit washed or per order fulfilled.
This is particularly valuable in operationally complex businesses. A factory may reduce total emissions in one month simply because production fell. Intensity reporting shows whether the process itself became more efficient. A plantation can compare fuel, fertiliser and harvest data by block or season. A labour-hire provider can track travel and site-related activity by client engagement, where appropriate data is available.
Choosing carbon accounting software for businesses
The right platform depends on reporting obligations, industry, data quality and how deeply a business needs emissions analysis embedded into daily operations. A retailer with several sites may prioritise electricity, refrigeration, waste and delivery data. A manufacturer may need production, machine, materials and maintenance data alongside finance records.
When assessing carbon accounting software for businesses, look beyond the reporting screen. Ask where the source data comes from, who owns it, how it is checked and whether the emissions calculation can be traced back to a transaction or operational event.
Start with data that already exists
Most businesses have more usable information than they expect. General ledger transactions, supplier invoices, purchase orders, stock receipts, fuel cards, electricity bills, travel claims and waste collection records are sensible first inputs. The priority is not to capture every possible metric on day one. It is to establish a repeatable process for material emissions sources.
A useful implementation begins with a clear data map. Identify each source, the person responsible, the reporting frequency, the unit recorded and the business dimension needed for analysis. For example, diesel may be recorded in litres but needs a vehicle, job or site code to produce useful management insight.
Keep calculation logic transparent
Emissions factors can change, and methodologies may differ by reporting purpose. Your software should preserve the factor used, its source, the period it applies to and any conversion steps. Finance teams are accustomed to audit trails for financial figures. Emissions figures deserve the same discipline.
Transparency also protects management from false precision. Supplier-specific emissions data is generally more meaningful than spend-based estimates, but it may not be available for every category. The system should distinguish actual activity data from estimates rather than presenting both as equally certain.
Build reporting around decisions, not only disclosure
Board reports and customer questionnaires matter, but the best carbon data supports operational decisions throughout the year. Managers should be able to compare sites, identify high-consumption equipment, review emissions per production unit and assess the carbon effect of procurement or freight choices.
Power BI dashboards can help bring this information into clear views for different users. A finance manager may need monthly emissions by entity and account category. An operations manager may need energy use against machine hours and output. An owner may want a simple trend, a target and exceptions requiring attention.
Integrating carbon data with ERP and machine activity
An all-in-one ERP platform reduces the effort required to connect carbon results to the activity that generated them. Financial accounting provides costs and invoices. Inventory and purchasing provide materials and suppliers. Sales and project management provide customer, job and revenue context. Production planning provides output, consumption and wastage.
For industrial operations, machine and PLC connectivity adds another useful layer. Meter readings, run time, temperature cycles or energy consumption can be captured closer to the process rather than reconstructed from monthly bills. This does not remove the need for governance, but it improves timeliness and gives teams a better chance to act before the reporting period closes.
There are trade-offs. Integrations require careful configuration, data quality checks and agreement on ownership. Not every meter needs to be connected immediately, and not every operational measure will materially affect reported emissions. Start with the sources that are significant, controllable and difficult to assess manually.
OneBusiness brings carbon accounting into a connected cloud ERP environment, allowing businesses to link financial, inventory, production and operational data while maintaining the practical workflows teams use every day.
A sensible rollout plan
Begin by defining the reporting boundary. Confirm which entities, sites, facilities and operational activities are included. Then establish a baseline period using available data, even if some Scope 3 categories are estimated. A baseline gives the business something more useful than a one-off report: a reference point for planning and improvement.
Next, assign ownership across finance, operations, procurement and IT. Carbon data is cross-functional. Finance may control reporting standards, while operations holds the information needed to explain usage and take action. Procurement can improve supplier information over time, and IT can support integrations, access controls and data retention.
Set a monthly review rhythm rather than leaving emissions work until year end. Review missing invoices, unusual movements, estimated values and data exceptions alongside normal financial close activities. This approach creates a cleaner audit trail and makes performance discussions more timely.
Finally, use the first reporting cycle to improve the process. If freight data arrives too late, revise supplier requirements. If an energy spike cannot be explained, add site or equipment-level data. If production intensity is not meaningful, reconsider the output measure. Carbon accounting should mature with the business rather than become a static compliance file.
Reliable emissions reporting begins with connected records and clear accountability. When carbon data sits alongside the financial and operational measures your teams already manage, it becomes easier to identify practical improvements, support customer requirements and make each decision with greater control and confidence.
Manage Carbon Emissions and Sustainability with OneBusiness ERP
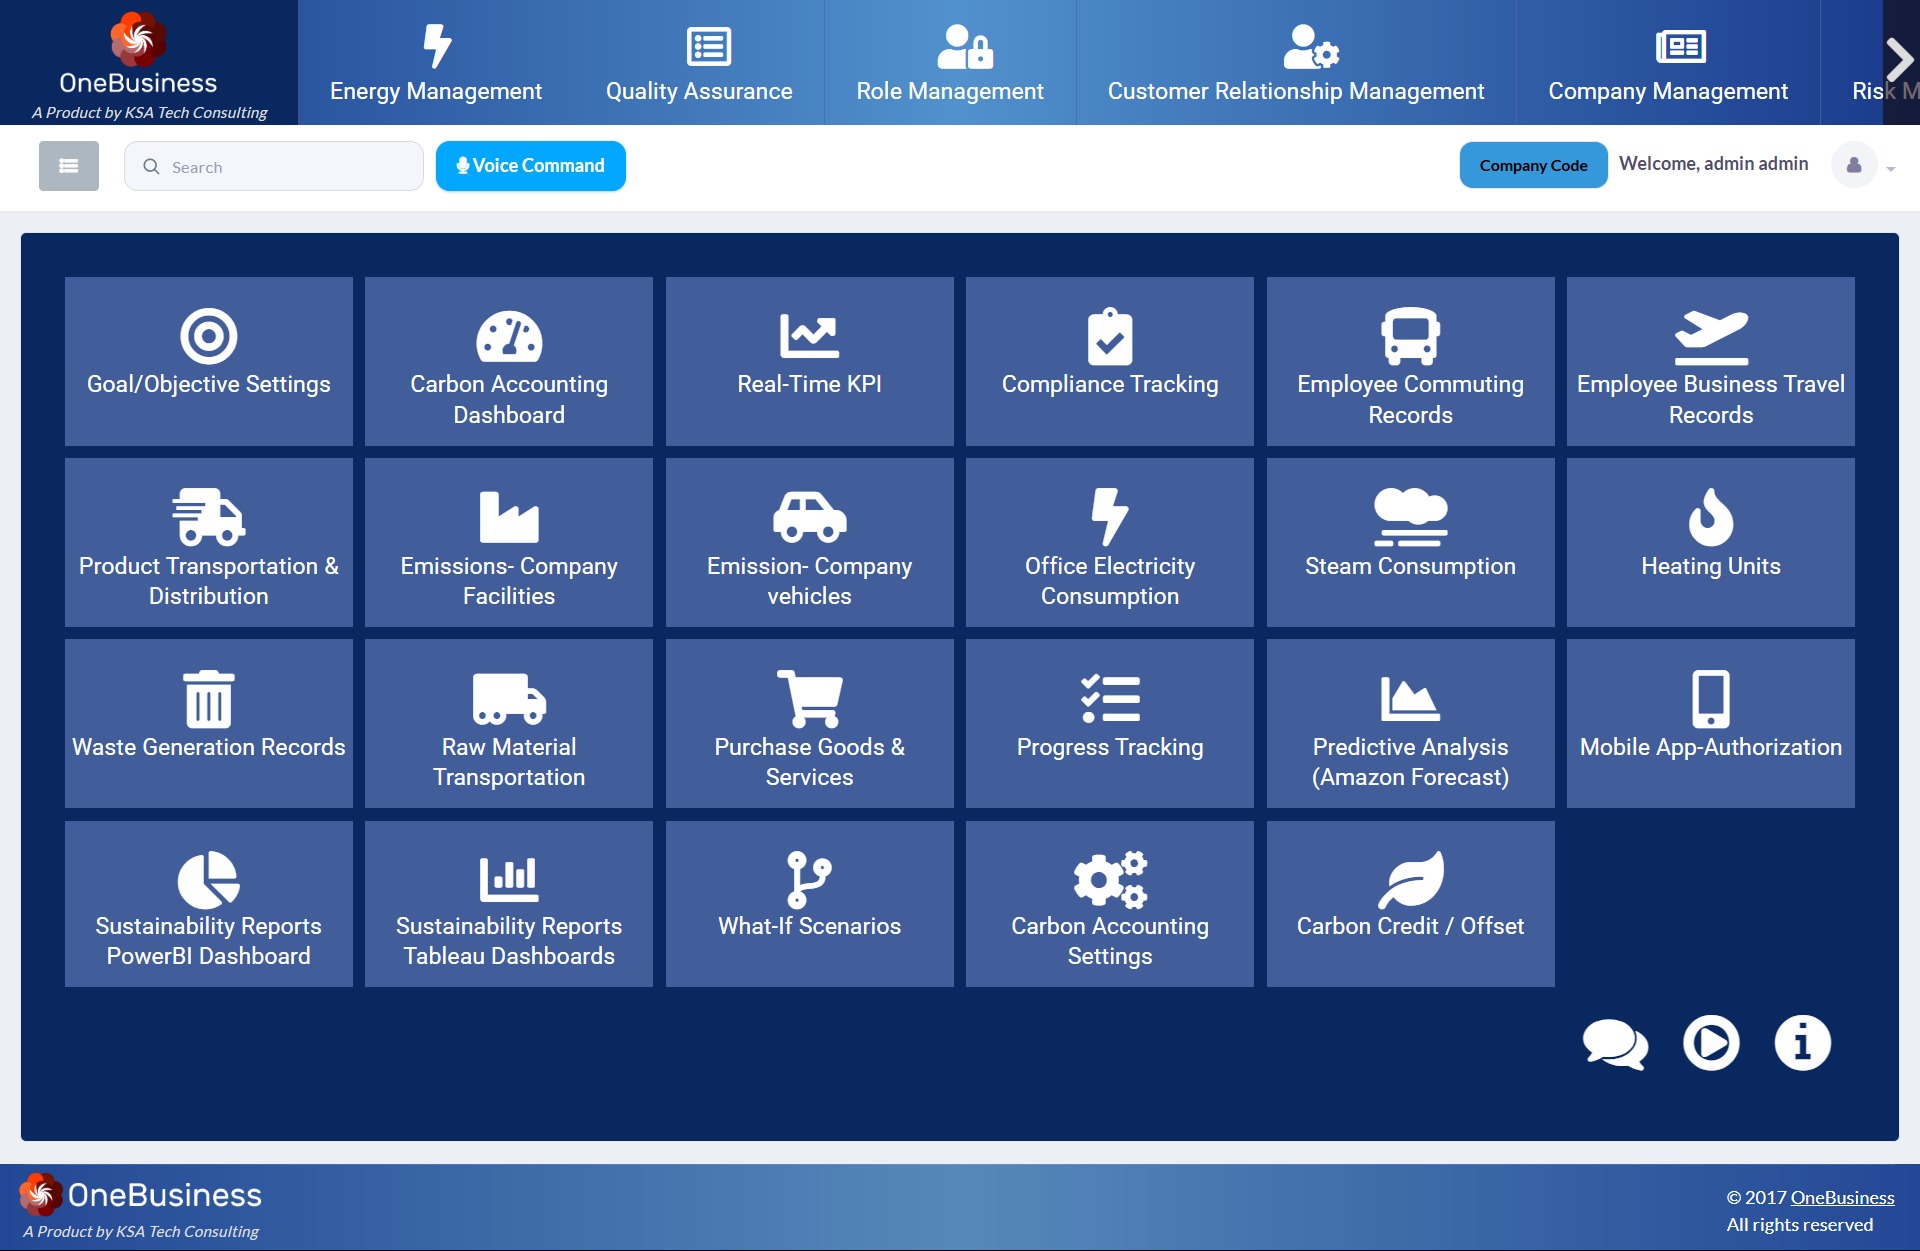
OneBusiness ERP’s carbon accounting software for businesses provides organizations with a centralized platform to capture, monitor, and manage the activities that contribute to their carbon footprint. The carbon accounting software for businesses records emissions-related data across areas such as employee commuting and business travel, product and raw-material transportation, company vehicles, office electricity, steam consumption, heating, waste generation, and purchased goods and services. Organizations can also configure carbon accounting settings, goals and objectives, carbon credits or offsets, and progress tracking, creating a structured approach to measuring and managing sustainability performance.
The carbon accounting software for businesses also supports real-time KPIs, compliance tracking, predictive analysis, and what-if scenarios to help organizations understand their environmental performance and plan improvement initiatives. Sustainability data can be presented through Power BI and Tableau dashboards, enabling users to visualize emission trends, compare performance, monitor sustainability targets, and identify areas that require attention. With features such as carbon accounting dashboards, sustainability reports, predictive forecasting, and carbon credit management, OneBusiness ERP provides carbon accounting software for businesses looking to move from manually maintained sustainability records toward a more connected and data-driven approach to carbon management.
Follow OneBusiness for updates on ERP, carbon accounting and sustainability: LinkedIn | YouTube | Facebook