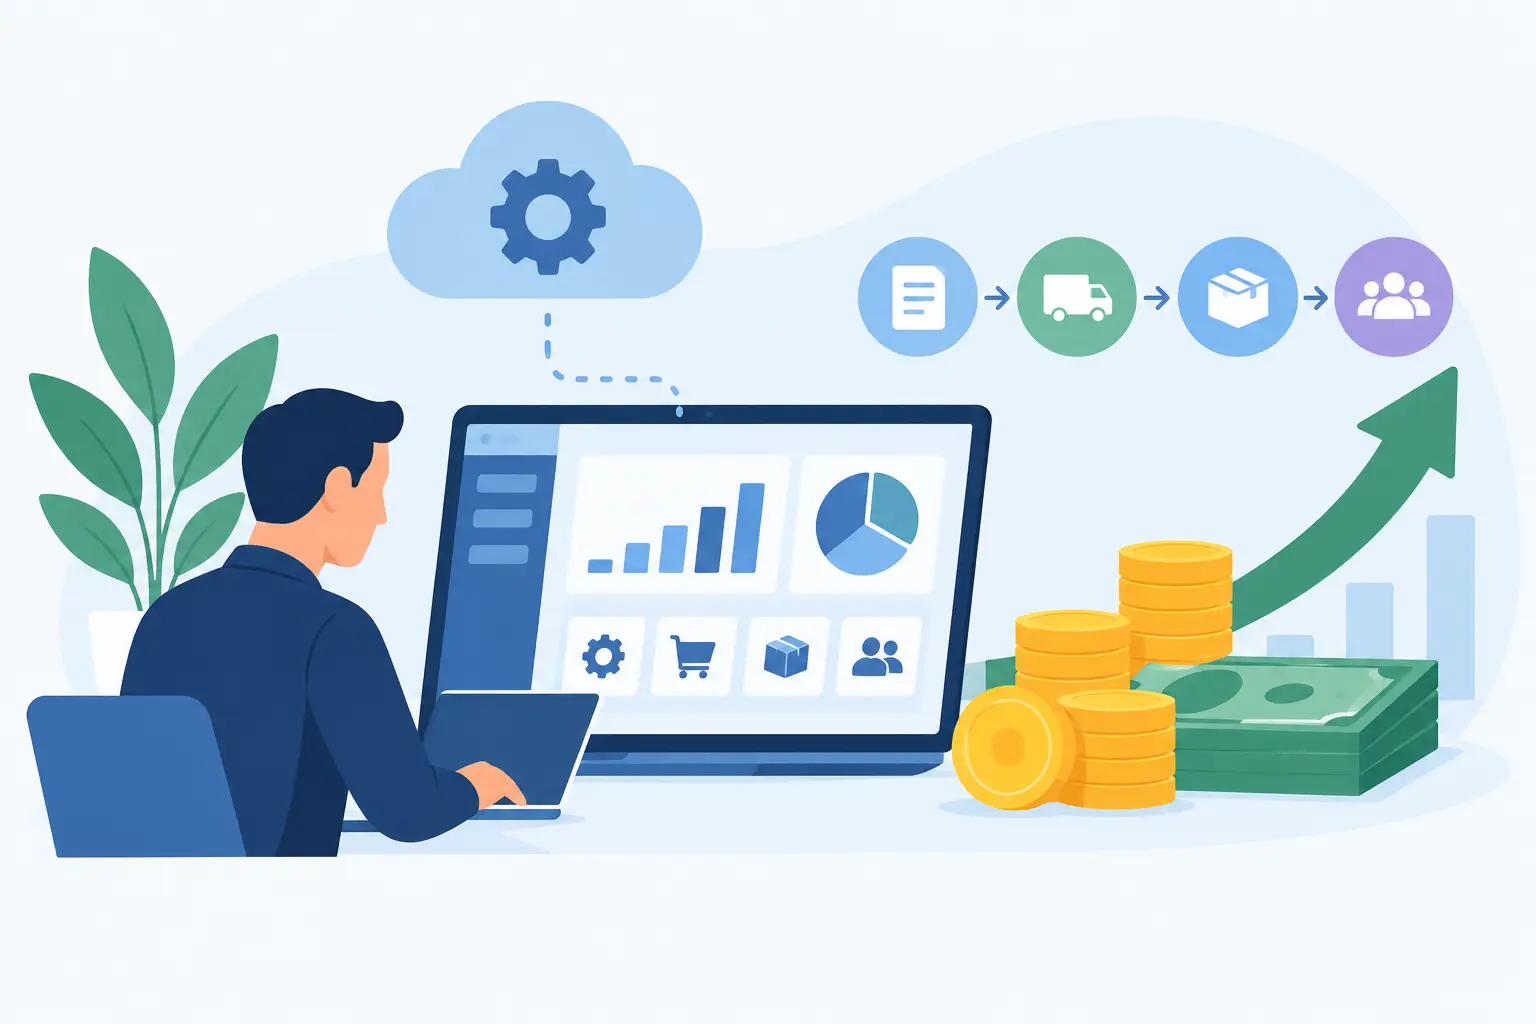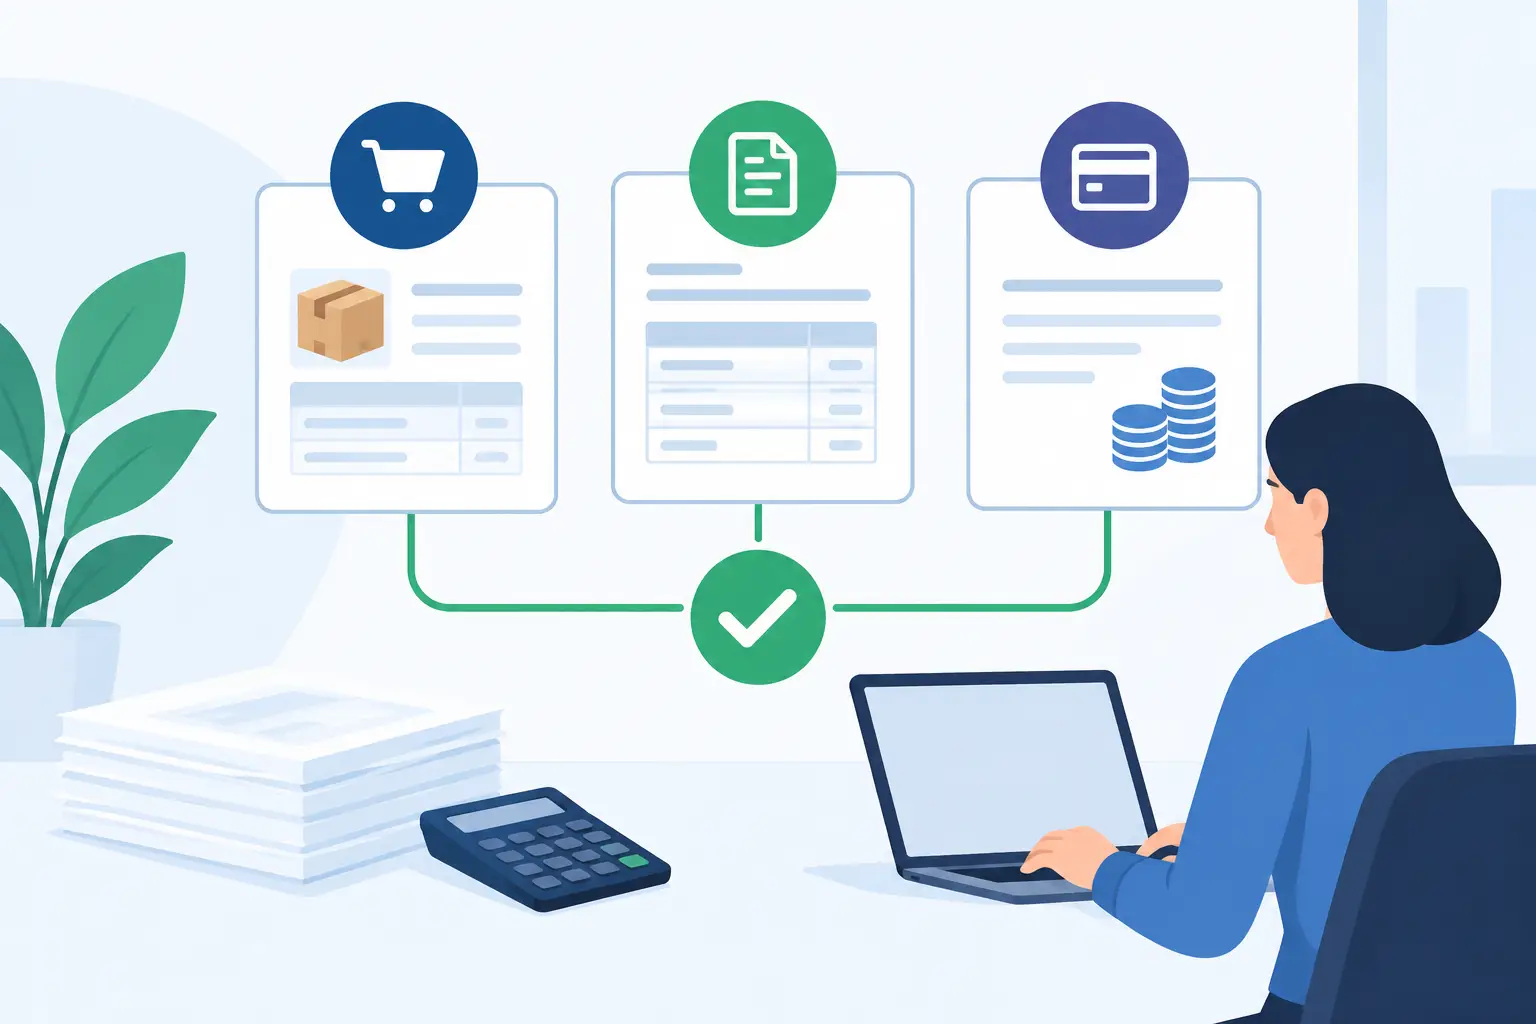

A finance team can close a month on time and still be surprised by a cash shortfall on Friday. That usually happens because the numbers live in separate places: accounting software, stock spreadsheets, production records, timesheets and sales reports. The best finance dashboards for SMEs bring those signals into one practical view, so owners and managers can act before a problem becomes expensive.
For an operational business, a dashboard is not just a prettier profit and loss statement. It should explain what is happening on the floor, in the warehouse, with customers and in the bank account. The right mix depends on your business model, but the eight dashboard views below cover the decisions most growing SMEs need to make.
What makes a finance dashboard useful?
Useful dashboards start with a decision, not a list of available data. If the question is whether the business can fund next week’s payroll and supplier run, a year-to-date revenue chart is interesting but insufficient. You need current bank balances, expected customer receipts, committed payments and a realistic cash forecast.
The other test is trust. A dashboard cannot be called real time if stock values are updated once a fortnight, labour costs are entered after payroll, or invoice status has to be manually reconciled. Finance data needs clear ownership, consistent account mapping and direct connections to the systems where work is performed.
For businesses with inventory, projects, production or labour hire operations, finance reporting should also include operational drivers. A margin decline may be caused by a supplier price increase, unrecorded waste, lower machine output, overtime or a poorly priced job. A connected dashboard makes that visible.
1. Cash flow and working capital dashboard
Cash flow is the first dashboard most SMEs should build. It shows cash on hand, forecast receipts, upcoming supplier payments, payroll, tax obligations and financing commitments over a short planning window, often 13 weeks.
The strongest version separates confirmed cash movements from assumptions. Issued invoices are not the same as expected receipts, particularly where customers regularly pay late. Likewise, a purchase order is not always an immediate payment, but it is a future commitment that should be visible.
Include days sales outstanding, overdue receivables, stock value and payable days to see what is tying up working capital. A retailer may need to focus on slow-moving stock, while a professional practice may gain more from reducing aged debtor balances. The dashboard should reflect that difference.
2. Profit and loss performance dashboard
A monthly profit and loss remains essential, but it is more useful when managers can compare actual results with budget, prior period and forecast. Revenue, gross margin, operating expenses and net profit need drill-down capability by entity, branch, product group, customer segment or cost centre.
Watch gross margin in both dollars and percentage terms. A higher-margin percentage on lower sales can still leave the business with less gross profit to cover overheads. For production and distribution businesses, the dashboard should flag changes in material costs, freight, discounts, wastage and labour absorption rather than leaving finance teams to investigate after month end.
Avoid presenting every expense line to every manager. Department heads need controllable costs and the operational measures behind them. Owners and finance leaders need the wider picture, including overhead movement and profitability trends.
3. Accounts receivable dashboard
Late payment is not merely an administration issue. It affects purchasing capacity, payroll confidence and borrowing costs. An accounts receivable dashboard should show total debtors, ageing buckets, invoices due this week, promised payment dates, disputed invoices and collections by customer.
Prioritisation matters more than volume. A list of 200 overdue invoices does not tell a collections officer where to start. Segment debt by value, age, customer risk and dispute status. A small number of overdue high-value accounts often deserves immediate attention.
It also helps to track invoice cycle time: from work completed or goods delivered, to invoice issued, to cash received. If invoicing is delayed because delivery records, timesheets or job approvals are incomplete, the root cause is operational. That is precisely why finance and operations need a shared view.
4. Accounts payable and commitment dashboard
A payable dashboard protects cash without damaging supplier relationships. It should display amounts due by week, early-payment discounts, approved invoices awaiting payment, purchase commitments and supplier concentration.
For manufacturers, processors and hospitality operators, purchase commitments are particularly valuable. Stock may be available today, but upcoming raw-material orders can place significant pressure on cash. Finance can then coordinate with procurement on order timing, minimum quantities and supplier terms.
This dashboard needs controls as well as visibility. Flag duplicate invoices, unapproved bills, unexpected price variances and purchases outside approved budgets. Automation can reduce routine checking, but a clear approval path remains necessary.
5. Inventory value and margin dashboard
Inventory is often the largest balance-sheet item in an operational SME and one of the easiest places for profit to disappear. The right dashboard combines inventory value with stock ageing, turnover, demand, reorder exposure, shrinkage and margin performance.
A high stock value is not automatically a healthy position. It may indicate a seasonal build, but it can also mean cash is trapped in obsolete or slow-moving items. In a plantation or processing environment, yield, grade, moisture or batch quality can materially affect both inventory value and eventual margin.
Finance leaders should be able to trace the value on the balance sheet back to locations, batches, production stages and stock movements. If physical stock counts do not agree with the system, no dashboard can provide a reliable answer until the underlying process is corrected.
6. Job, project and production profitability dashboard
Businesses that quote work, manufacture to order, manage projects or supply labour need a view of profitability before the work is finished. Waiting for final invoicing is too late to recover an overrun.
Track quoted versus actual material, labour, subcontractor and overhead costs, alongside progress billing, work in progress and estimated cost to complete. A construction-style project may focus on variations and committed costs. A garment washing or tannery operation may focus on batch yields, rework, chemical consumption and machine time.
The key is timeliness. Labour and material transactions must be captured close to the work itself. Integrations with production equipment, barcode processes or PLC data can provide more credible output measures where manual recording would be slow or unreliable.
7. Sales, pipeline and revenue forecast dashboard
Revenue forecasting works best when it combines finance data with commercial activity. The dashboard should show confirmed orders, sales pipeline, expected close dates, recurring revenue, cancellation risk and conversion rates. For wholesalers and retailers, order backlog and fulfilment status should also be visible.
Do not treat every opportunity as equally likely. Forecast revenue using weighted probabilities and review assumptions with sales leaders. A cautious forecast is usually more useful for staffing, purchasing and cash planning than a target dressed up as a certainty.
Compare forecast demand with inventory availability, production capacity and labour requirements. This turns a sales dashboard into a planning tool rather than a monthly scorecard.
8. Executive performance and exception dashboard
Owners, general managers and boards need a concise view that connects financial outcomes to operational causes. This dashboard can bring together cash position, revenue, gross margin, debtor days, inventory value, overdue payables, utilisation, production output and forecast variance.
Its value comes from exceptions. A green dashboard full of historical figures creates little action. Instead, highlight the few changes that require a decision: a margin below target, a customer account moving into high-risk ageing, a project forecast to exceed budget, or stock approaching expiry.
This is also a useful place to include carbon and energy measures where they affect customer requirements, operating cost or compliance. Carbon accounting becomes more practical when it is linked to production volumes, freight, energy consumption and financial performance.
How to choose the best finance dashboards for SMEs
Start by mapping the systems that currently produce each number. If cash sits in one tool, invoicing in another, warehouse activity in a third and production records on paper, a business intelligence layer alone may improve presentation without fixing the data problem.
For many SMEs, the better long-term approach is a connected ERP foundation with accounting, sales, purchasing, inventory, projects and production using the same core records. Power BI can then provide flexible visual reporting without forcing staff to export and reconcile spreadsheets each week. OneBusiness supports this approach with configurable operational workflows, integrated finance and Power BI analytics for businesses that need more than standalone accounting reports.
There are trade-offs. A simple cloud accounting dashboard can be quick to deploy and adequate for a service business with straightforward billing. An integrated platform requires more process design and implementation effort, but it delivers stronger traceability when stock, labour, machines, batches or multiple sites influence financial results.
Before selecting any dashboard solution, test it against a real management question. Ask whether it can show the source transaction, whether figures reconcile to the general ledger, how often data refreshes, who can see sensitive information and what happens when a workflow changes. Cybersecurity permissions, audit trails and role-based access are part of finance reporting, not add-ons.
The dashboard that earns its place is the one your team checks before making a decision: whether to release a purchase order, chase a customer, schedule overtime, reprice a job or invest in capacity. Build for those moments, and finance becomes a practical operating system for confident growth.