SAP Project Progress calculations
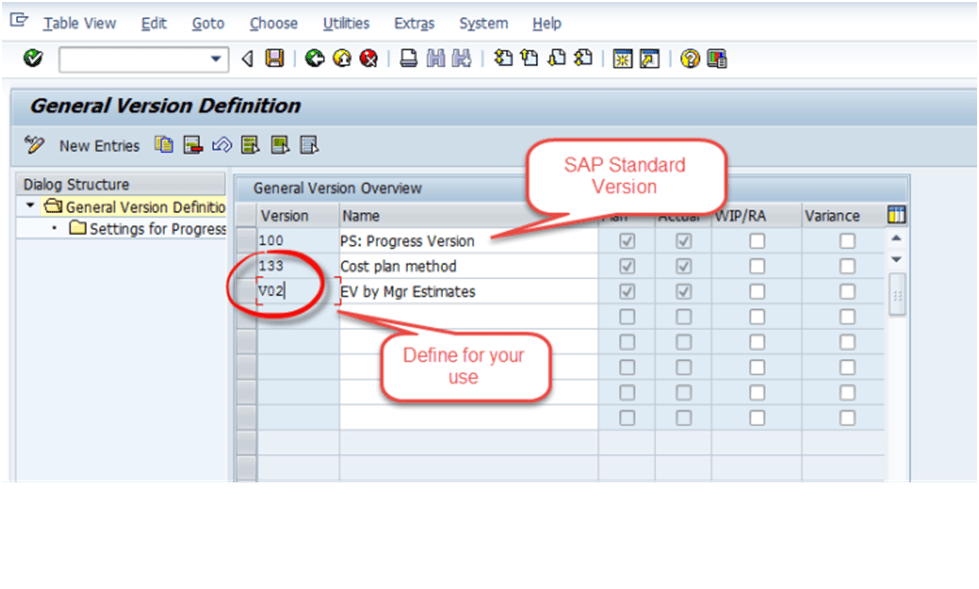
Introduction: SAP Project progress calculations. This blog will explain the SAP Project System progress calculations and review procedures. This post will be helpful for SAP Project System users who are not currently using this feature. We strongly recommend you utilise the services of an experienced SAP PS Consultant to perform the configuration activities related to the project progress calculations feature.Current State: You are using SAP Project System to manage your projects, including planned costs, Actual costs, commitment, and budget. But you are not checking the progress reports to report the project progress. You are using external systems to track your project progress. Future State: You plan to use the SAP standard features of earned value analysis for all your projects. Hence, you plan to complete the project progress calculation pre-requisites, master data setup and configurations. The SAP project consultant will perform the configurations. Pré-requisites 1. The primary progress calculation configuration requires the following pre-requisites met • Progress versions- Maintain Progress Version
Fig 1: Maintain Progress Version
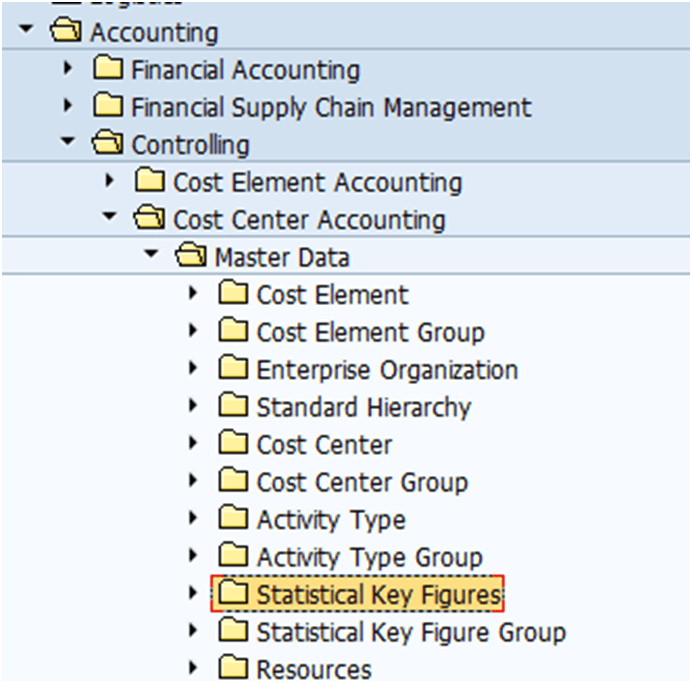
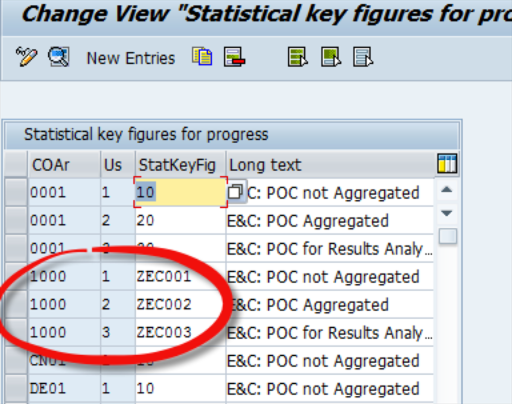
• Define Statistical Key Figure for Percentage of Completion
Fig: 2 Maintain statistical key figure
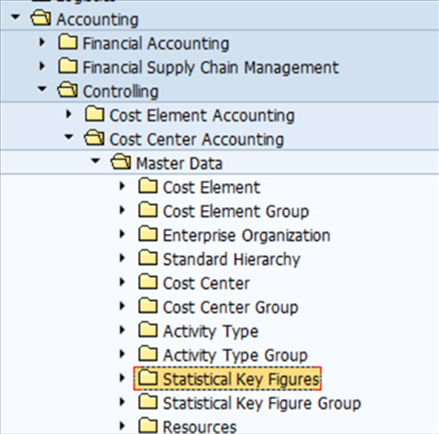
Fig 3: Maintain statistical key figure
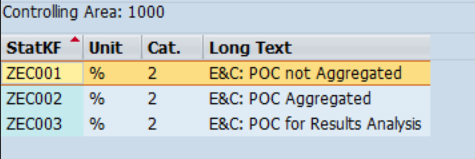
Underthe “Define Statistical Key Figure for Percentage of Completion” configuration, assign the Statistical Key Figures and check the assignment.
Fig 4: Check SKF assignment
Note: Please ensure you create vital statistical for other controlling areas.
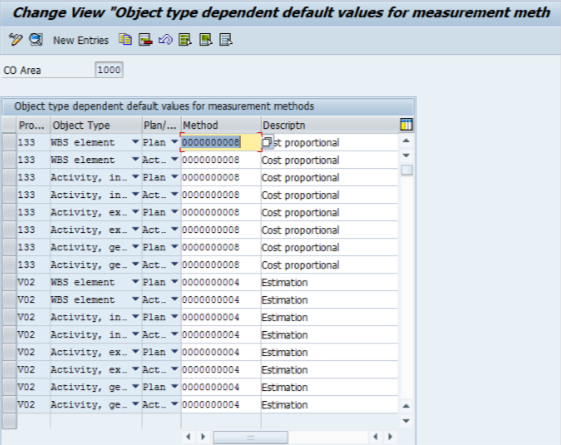
• Define Measurement Methods as the default value
Fig 5: Define Default methods
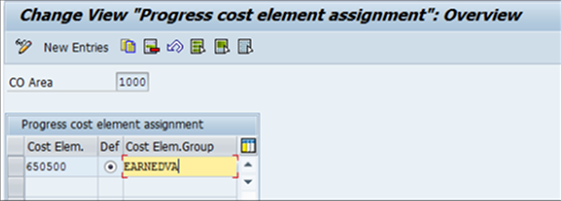
• Maintain Assignment of Cost Element Group
Fig 6: Maintain Assignment of Cost Element Group
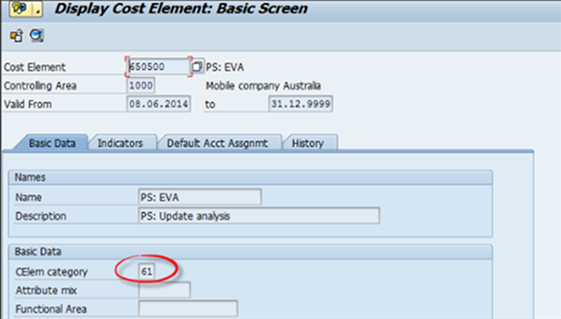
You will create the cost element with category 61 in SAP Easy access.
Fig 7: Cost Element creation
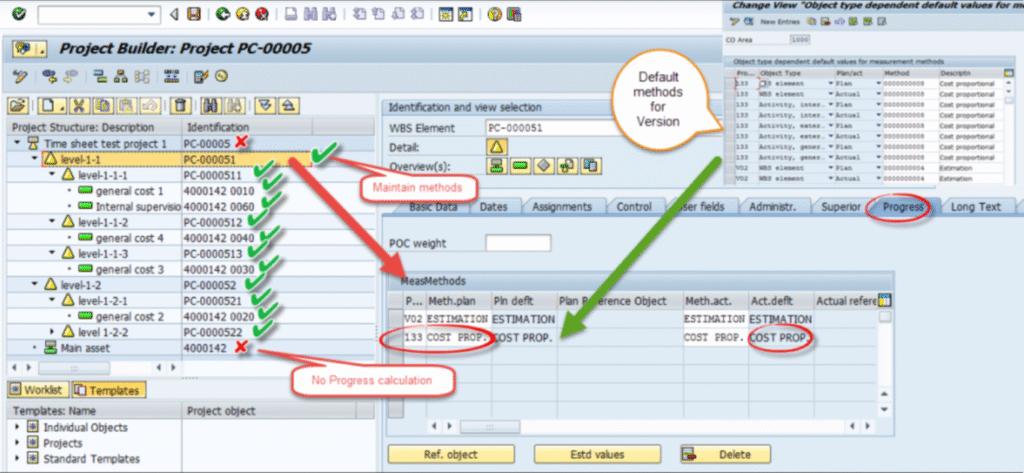
Master Data Setup 1. Progress methods assignment in the project objects
Fig 8: Project methods assignment in the project
2. Planning overall or annual costs is a must to compare the plan vs actual in the progress calculation. 3. Post actual costs to activities are part of project execution. The “Cost Proportional” method considers the actual cost to calculate the progress 4. The estimation process requires manual entry of progress value against the object by a project team member or project manager. Please note to enter the progress of the individual thing; theentity should have actual dates; you achieve this by confirmations.
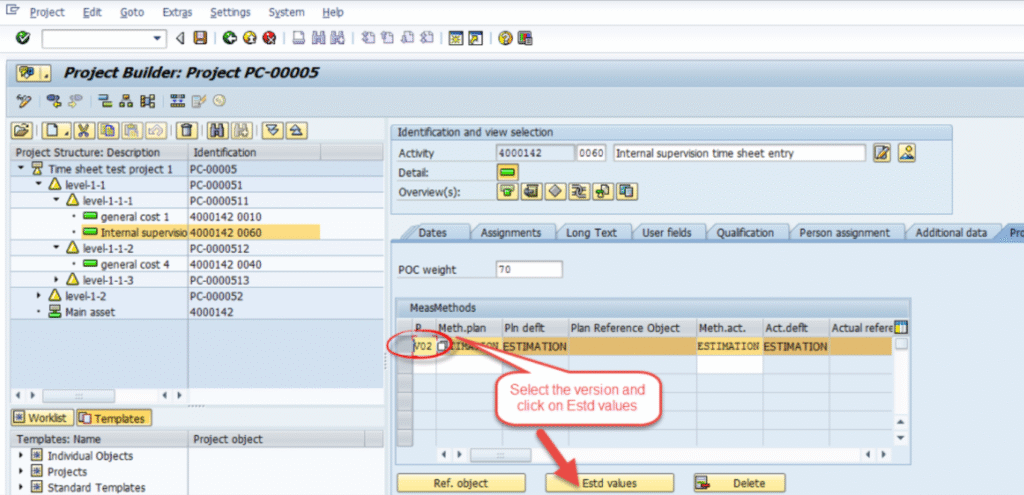
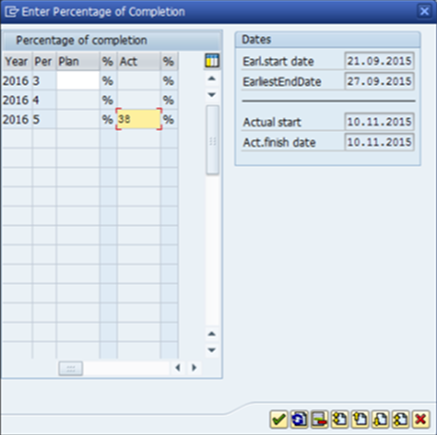
Fig 9: Estimation method progress % entry
Fig 10: Estimation method progress % entry
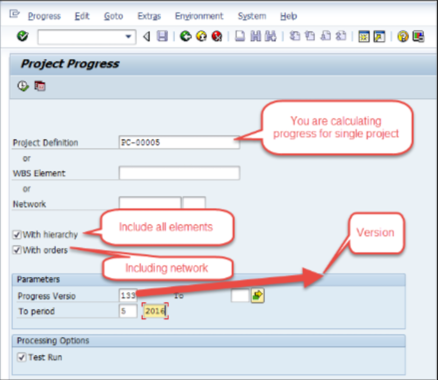
Proper scheduling/activity confirmation will allow you to enter the plan and actual POC. 5. Project team members should have performed the date schedule.The primary dates and scheduled dates should be available on the project objects. SAP Transaction Codes to calculate project progress: CNE1- Individual Progress calculation CNE2-Collective Progress calculation (This blog will cover only Individual progress calculation)
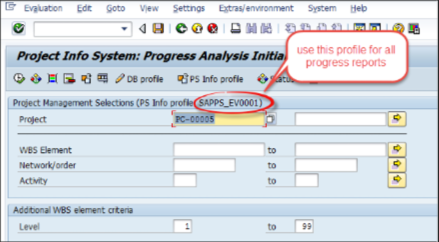
Fig 11: Progress calculation
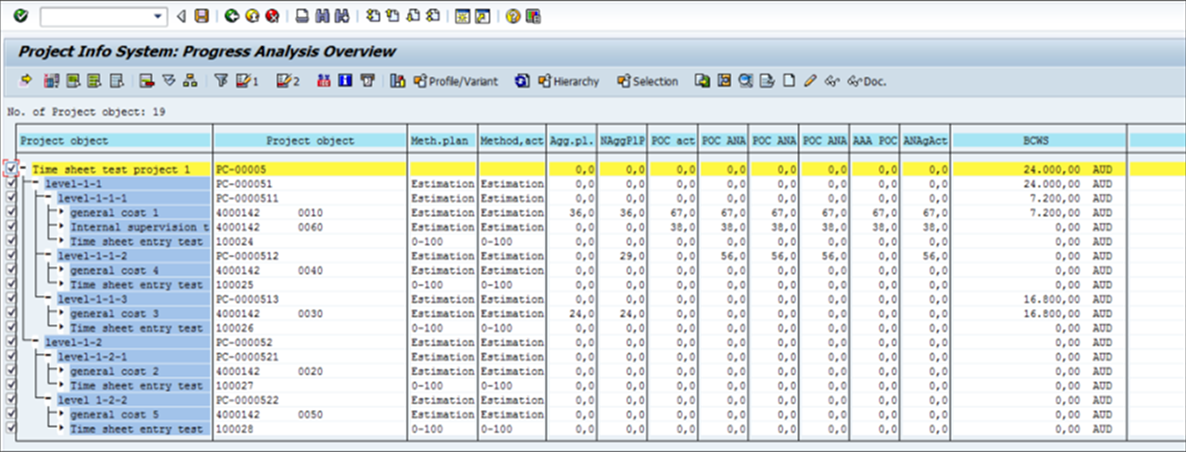
Reports to Verify the Project Progress 1. CNE5 – Structure Overview
Fig 12: CNE5 Report execution
Fig 13: CNE5 Report output
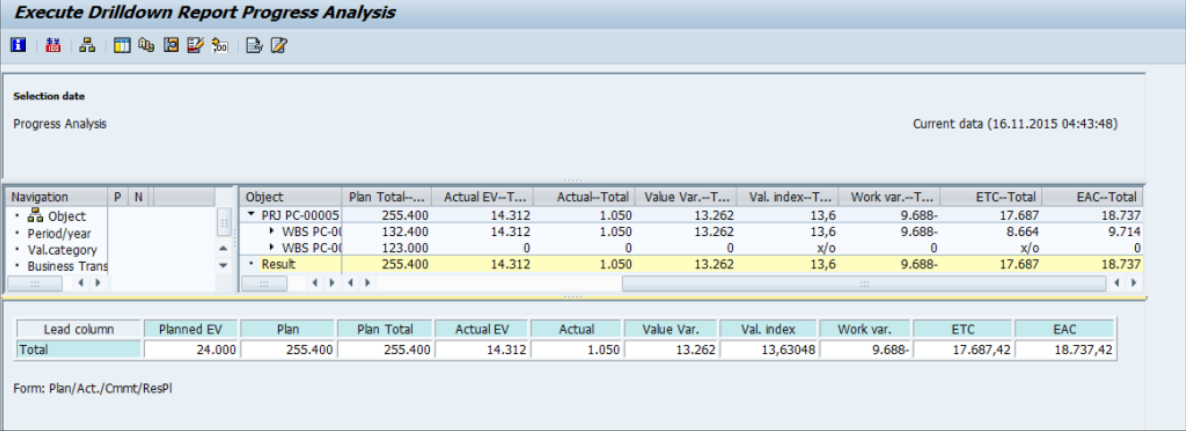
2. S_ALR_87015124 – Project Hierarchy
Fig 14: Hierarchy report output
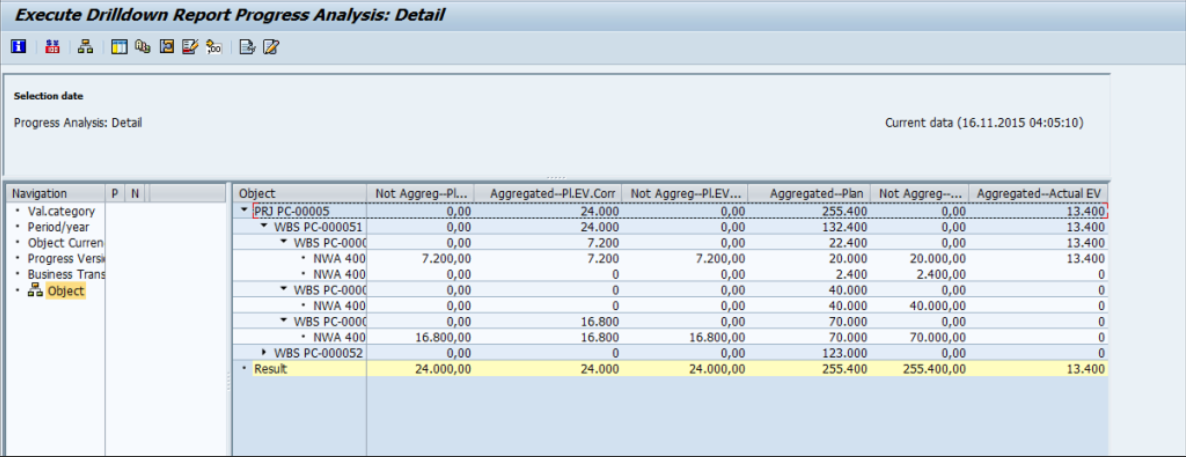
3. S_ALR_87015125 – Details
Fig 15: Project progress details report output
Fig 16: Progress details report output
Progress Analysis : We will analyse the following key figures for the project objects:
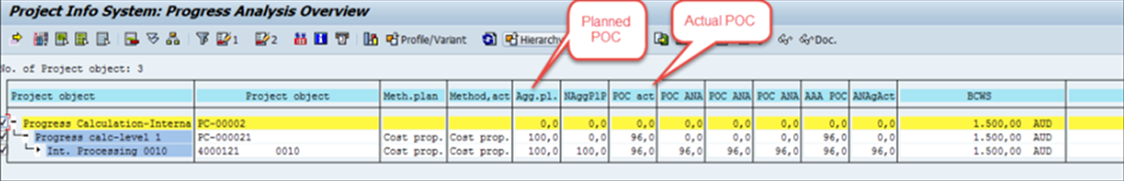
The planned POC is the value of the Work planned. This POC value is a percentage (%) of all the Work required.
Fig 17 Planned POC %
The % of Work up to a certain point (current period) is the actual
POC. In the estimation method, it is a value entered against the individual activity and aggregated to the level 1 WBS element. The Cost proportional method is calculated automatically by comparing the plan and actual costs.
Fig 18 Actual POC %
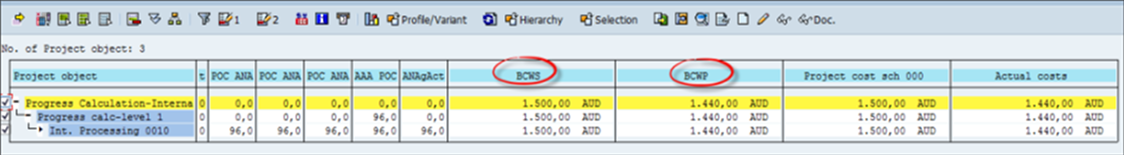
The Budgeted Cost of the Work scheduled is the value that represents the value of the planned activity. The system multiplies the planned POC and the overall costs to get this BCWS in the reports.The value in this example is 1500.
Fig 19: BCWS
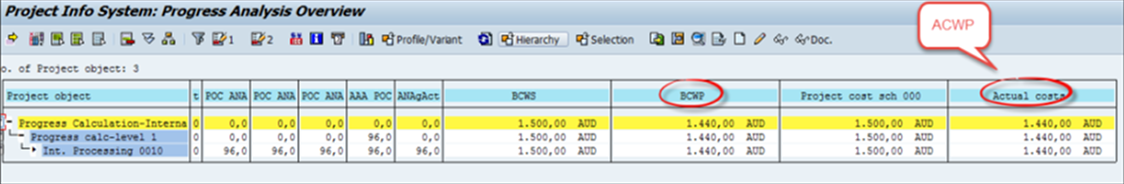
The Budgeted Cost of the Work performed is the value that represents the value of the actual activity. The system multiplies the primary POC and the overall costs to get this BCWP in the reports.The value in this example is 1440.
Fig 20: BCWP
The actual cost of Work performed is the project’s actual cost up to the current period. In this example, the actual price is 1440( ACWP)
Fig 21: ACWP
Cost Variance (CV)
Fig 22: Cost Variance
Cost variance is the difference between the BCWP and the ACWP.
CV = BCWP – ACWP (1440-1440=0)
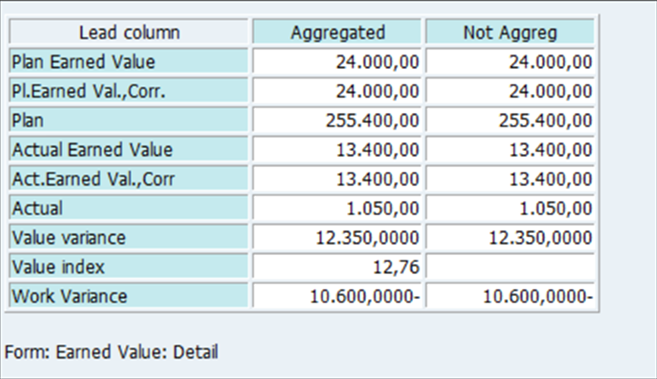
You calculate the Schedule Variance (or Work Variance) as the difference between
BCWP and BCWS (1440- 1500 =-60)
Fig 23: Schedule variance
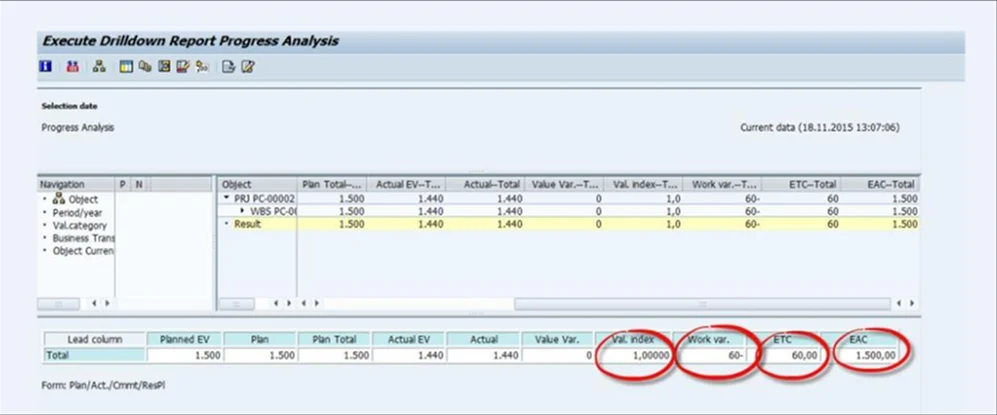
Value Index (CPI)
You calculate theValue Index as the ratio of BCWP and ACWP; in our example, the value index is 1500/1440=1.041
Fig 24: Value Index
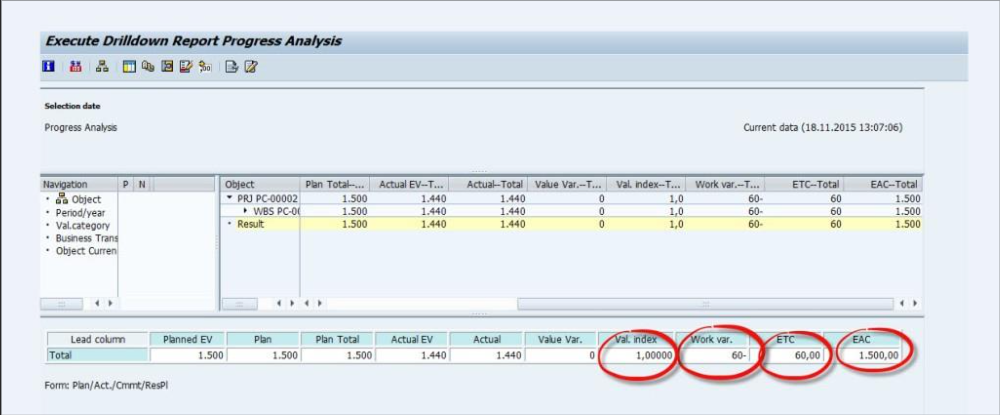
Estimated costs at completion (EAC)
Fig 25: EAC
You estimate the EAC as the final cost after the project
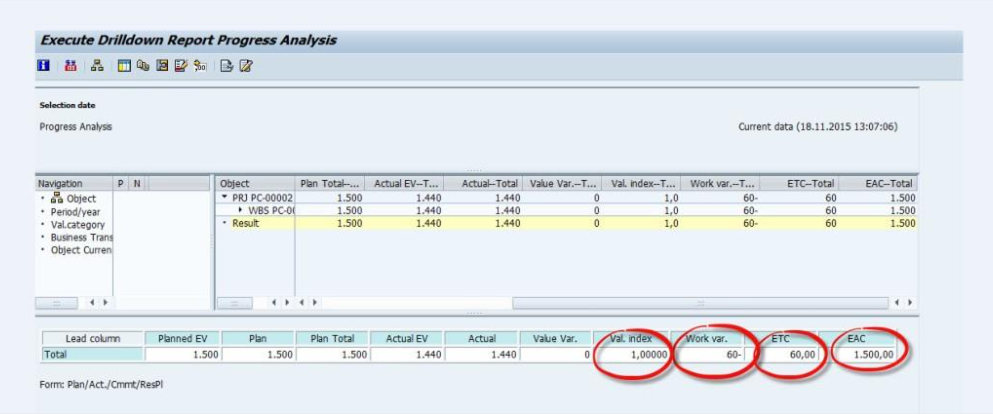
- Estimate to Complete (ETC)
Fig 26: ETC
Estimate to Complete is the second forecasting technique used along with the Estimate at Completion. It is the amount of money to complete the remaining Work (the Work left after a particular period).
Mobile Application for Project Progress calculation:The progress calculation and the progress view are available on the move, and the SAP Mobile Application for the Project progress calculation is available from KSA Tech Consulting Pty Limited, Sydney (onebusinesserp.in)